Tuesday, September 15, 2026 · Trucking & Freight
Fleet Managers Face Higher Fuel, Maintenance Costs and a Rising Safety Benchmark
Noted by Matthew Villaflor · 372 reads
Diesel reached $5.652 per gallon in August 2026 as repair costs climbed. The data points fleets toward tighter cost controls, sustained coaching and ADAS.


Fleet budgets face pressure from higher fuel prices, rising repair costs and an improving road safety baseline. The data behind five trends for 2026 points to practical steps: reduce unproductive miles and idling, connect operating data, schedule maintenance from vehicle health signals, sustain driver coaching and specify safety systems on new vehicles.
The figures also complicate expectations around electrification. Electric vehicle sales fell in the first half of 2026 after federal purchase credits expired, while hybrids gained share. For fleet owners, the operating route and charging setup now carry more weight in acquisition decisions.
Fuel costs are no longer following the recent pattern
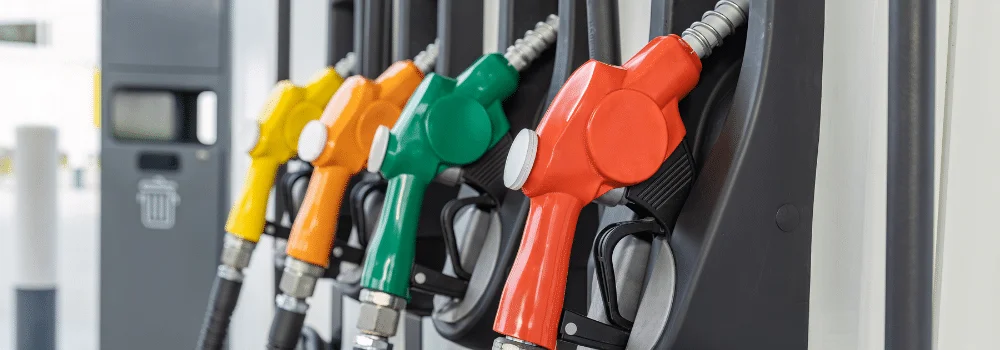
U.S. on-highway diesel averaged $5.652 per gallon on August 24, 2026, up $1.944 from a year earlier, according to the U.S. Energy Information Administration (EIA). Regular gasoline reached $4.085 per gallon, a year-over-year increase of $0.938. Those changes amount to increases of more than 50% for diesel and 30% for gasoline.
The American Transportation Research Institute (ATRI) measured a separate cost baseline in its July 2026 operational cost analysis. The average cost to operate a commercial vehicle reached a record $2.336 per mile in 2025, up 3.4%. The two data sets cover different periods: ATRI's figure reflects 2025, when fuel costs were stable, while EIA's August figures show a much sharper rise in 2026.
Fleets that carried their 2025 fuel assumptions into 2026 may find that budget line out of date. The operating response lies in areas managers can influence directly:
- Miles: Route optimization can reduce travel that produces no additional revenue. Fewer miles also mean less fuel use, vehicle wear and maintenance demand.
- Idling: A parked vehicle burning fuel adds expense without moving freight or serving a customer. Telematics can reveal how often vehicles idle and help managers target excessive use.
- Driver behavior: Hard acceleration, speeding and harsh braking affect fuel economy. Coaching drivers on those habits can improve efficiency across existing vehicles without requiring new equipment.
With operating costs already at a record per-mile level, even small savings can affect fleet profitability. Managers can start by comparing current fuel assumptions with EIA prices and measuring whether changes to routes, idling and driving behavior reduce consumption.
Disconnected software is under pressure to justify its cost
Higher operating expenses are pushing fleet buyers to review what each software subscription contributes. GPS tracking, cameras, inspections and routing often sit in separate systems, creating overlapping data and manual reconciliation work. The trend is toward platforms that bring those functions together, with cost reduction a central reason to consolidate.
Connected systems can make operational data more useful when location, driver behavior, vehicle condition and route performance can be considered together. A fleet may already collect information across its tools but still struggle to see which vehicle, route or driver is behind a cost change. Consolidating those views can also help identify duplicate subscriptions and repeated data handling.
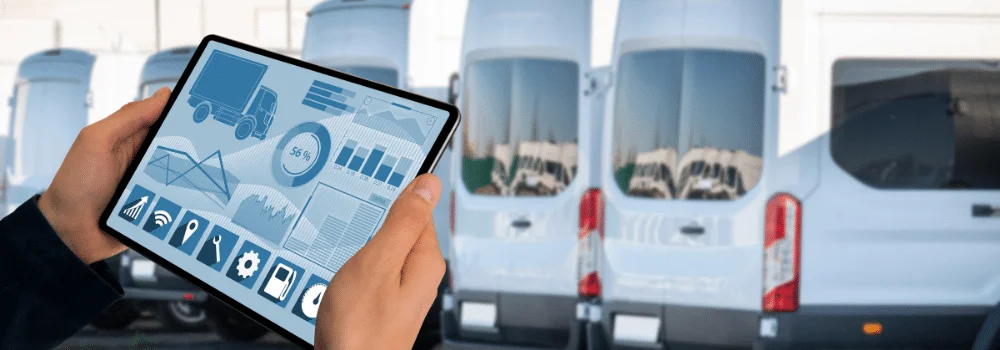
For procurement teams assessing a platform, the practical question is whether it can replace separate applications and improve operating decisions with connected data. Integration is valuable when it reduces extra spending or gives managers a clearer picture of fleet performance.
Repair costs reward earlier intervention
ATRI's analysis found that repair and maintenance costs rose 8.6% in 2025, the second-largest percentage increase among the listed operating expenses. Tolls rose 13.2%, driver benefits 6.6% and tires 6.4%. Repair, maintenance and tire costs are tied to how vehicles are used and serviced, giving fleet managers more room to influence them than costs set externally or required to retain staff.
A reactive maintenance approach can bring several expenses at once: the repair, a tow, expedited parts and lost operating time. Maintenance based on vehicle health data can instead help teams schedule work before a fault becomes a breakdown. The point is to address emerging problems while a vehicle can still be planned into a shop schedule.

Many fleets already have access to signals that support earlier intervention:
- Diagnostic trouble codes, engine hours and mileage can show changes in vehicle performance before a breakdown.
- Digital inspection reports can send identified defects to maintenance staff when a driver reports them, rather than leaving the information on a paper form until the end of a shift.
- Scheduling service around actual vehicle use can reveal failed or weakening components that fixed calendar intervals may miss.
Time spent in a repair bay is time a vehicle cannot generate revenue. Improving the timing of service can therefore support both cost control and fleet utilization, helping operators get more working days from the vehicles they own.
Dash cameras need a coaching process behind them
The case for dash cameras increasingly depends on what managers do with the information, not on the hardware alone. A driver monitoring evaluation by the Federal Motor Carrier Safety Administration (FMCSA), known as FAST DASH, tested an onboard system that gave drivers real-time audible feedback. It used GPS and motion sensors to track speeding, seatbelt use and aggressive driving; it did not use cameras.
The evaluation recorded clear changes in some behaviors during the initial intervention. Speeding violations fell 37%, and seatbelt violations fell 56%. The system did not significantly reduce safety-critical events, including crashes and near crashes. Researchers also found that the improvement in speeding faded over time, linking that pattern to inconsistent fleet manager engagement.

The findings suggest that monitoring can identify behavior and produce an early response, but the benefit may not last if managers stop reviewing results and coaching drivers. For camera programs, that makes a repeatable process essential: review relevant footage, discuss specific behavior with the driver and document the follow-up. A camera that only records events may generate data without changing what happens on the road.
Documentation also gives a fleet a record of how it identified and addressed driver risks. The source article argues that the record can matter if a serious injury case follows. For day-to-day operations, the immediate lesson is straightforward: assign responsibility for reviewing footage and keep coaching consistent after a program launches.
Falling road deaths raise expectations for fleet safety
The National Highway Traffic Safety Administration's National Center for Statistics and Analysis estimates that 36,640 people died in motor vehicle crashes in 2025, down about 6.7% from 39,254 in 2024. If confirmed, the decline would be the fifth-largest percentage decrease in the recorded history of the Fatality Analysis Reporting System and would bring deaths back to 2019 levels.
The trend extends beyond the annual total. The fourth quarter of 2025 marked the 15th consecutive quarterly decline, a sequence stretching back to the second quarter of 2022. The fatality rate fell from 1.19 to 1.10 per 100 million vehicle miles traveled, the second-lowest rate recorded, behind 2014. The agency's estimates project decreases across all 10 regions, 39 states, the District of Columbia and Puerto Rico, despite an increase of about 29.8 billion vehicle miles traveled.
As national results improve, a fleet with an unchanged incident rate may compare less favorably against the broader driving population. The article points to insurers and claims arguments as settings where that comparison could matter. For fleet managers, the operational question is whether their safety performance is keeping pace with the surrounding trend.
Vehicle technology is one part of the improvement. Research by the Insurance Institute for Highway Safety (IIHS) on large trucks found that forward collision warning systems were associated with a 44% lower rear-end crash rate, while automatic emergency braking was associated with a 41% lower rate. Trucks equipped with forward collision warning had 22% fewer crashes per mile driven; those with automatic emergency braking had 12% fewer. In crashes involving either system, trucks shed more than half their speed between the alert and impact. The analysis covered 62 carriers, about 2,000 crashes and more than 2 billion miles.
Those results give fleet acquisition teams a concrete basis for considering advanced driver assistance systems (ADAS). A truck or van bought today may remain in service for years, so its safety equipment will shape the fleet's capabilities well beyond the purchase date. Forward collision warning and automatic emergency braking can support both risk reduction and a fleet's ability to keep pace with a rising safety baseline.
Electrification decisions depend more on duty cycle
Changes to purchase incentives and vehicle rules have altered the financial case for fleet electrification. The federal Clean Vehicle Credit and Qualified Commercial Clean Vehicle Credit expired on September 30, 2025. EIA data show electric vehicles accounted for 6% of new vehicle sales in the first half of 2026, down from 7% a year earlier. Sales had reached a record 12% in September 2025 as buyers moved to purchase before the credits expired.
On February 12, 2026, the Environmental Protection Agency finalized the rescission of the 2009 Greenhouse Gas Endangerment Finding and subsequent greenhouse gas standards for light-, medium- and heavy-duty on-highway vehicles and engines. The rule is being challenged in the D.C. Circuit, so the source describes its status as current rather than settled. The change removes the federal requirement for manufacturers to reduce carbon dioxide emissions per mile on new commercial vehicles while that status remains in effect.
The sales figures show that electric vehicles have not continued their earlier growth in the U.S. market, while the regulatory driver described in the source has changed. Hybrid vehicles, which also do not qualify for the expired credits, reached a record 16% of sales in the second quarter of 2026.
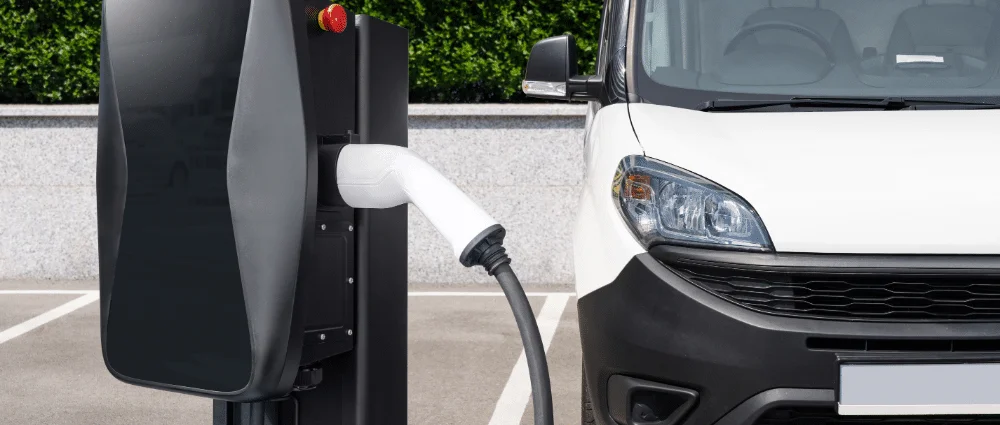
For fleet owners, the fit between a vehicle and its work remains central. Electric vehicles can suit predictable routes that return to base, have depot charging available and accumulate enough daily mileage to support the purchase cost. Fleets evaluating orders can compare those operating conditions with hybrid and conventional options instead of assuming one powertrain will suit every route.
Measures to review before the next quarter
The figures suggest several useful checks for fleet teams. Reprice fuel budgets against current EIA figures, then compare repair and maintenance cost per mile over the past 24 months with ATRI's 8.6% industry increase. Identify the most common vehicle failure modes and check whether diagnostic data shows warning signs ahead of breakdowns.
Managers can also audit whether camera footage is reviewed consistently and whether driver coaching continues after rollout. On the acquisition side, check whether recent vehicle orders included forward collision warning and automatic emergency braking. Finally, list systems that store the same data and assess whether consolidating them would reduce subscription costs or manual work.
These trends depend on information vehicles already produce: fuel use, location, mileage, engine condition, inspection results and driver behavior. When those records sit in separate systems, a fleet can see that costs rose without being able to pinpoint the vehicle, route or operating habit behind the change. Connecting the data makes it easier to target action and measure whether it helped.
Fleet managers can begin with a small set of measures, such as fuel use per mile and repair cost per mile, and track them over a quarter. The useful result is not a larger software stack by itself; it's evidence that a change to routing, maintenance, coaching or vehicle specifications improved fleet operations.